Reproducible Data Science Workflows in Climate-Smart Public Health Research
🌍🤖📊

A practical guide for students

Tinashe M. Tapera, Research Software Engineer

2025-06-24

Welcome 👋

Why we’re here

1

  • Guide you to sustainable, reproducible, and collaborative data science workflows.
  • Orient you to cluster computing using Harvard FASRC, not your laptop.
  • Introduce principles and tools that help you focus on science, not logistics.

Meet Squidward…

Day 1 of grad school vs. Day ???

  • Squidward is a graduate student who is excited to do the science
  • Eventually, Squidward becomes tired, overworked, demotivated, and hungry
  • Squidward’s work quality suffers as he gets overwhelmed by grad school and he starts to take shortcuts
    • Not documenting his work
    • Manually moving files
    • Hard-coding programming loops/recursion
    • Running long code on a slow laptop
    • Arbitrarily naming files and versions

Fragile Workflows ⛓️:

  • Stored only on personal machines
  • Manual file movements (click-and-drag)
  • Impossible to reproduce or share
  • Outputs treated as “truth”

Robust Workflows 🔗:

  • Portable across systems and environments
  • Can be automated
  • Replicable & reproducible
  • Source of truth is “how”, not “what”
  • Robust workflows make doing the right thing the easy thing

Where is the source of truth? 🧐

2

  • Claim: title
  • Evidence: data
  • Truth: methods

Proposing A Data Science Philosophy 💬

  • Prefer remote + reproducible over local + manual
  • Code, not outputs, should be the source of truth
  • Narrate your thinking with notebooks
  • Track your work with Git
  • Save on technical debt by investing in robust systems
  • 3

What We’ll Cover Today 📋

Principle Tool What You’ll Learn
Efficiency FASRC Remote computing
Transparency Notebooks Narrated and reproducible scientific analysis
Modularity here() + renv Robust file paths & environment isolation
Traceability Git + GitHub Version control and team collaboration
Flexibility googledrive + pins Reproducible I/O with shared cloud data

Let’s walkthrough the research process together…

All screenshots and examples are in the google drive folder: Climate-Smart-Public-Health/Lab Organization/Meetings & Communications/2024-2025/20250624_Tinashe_DataScienceWorkflows/Screenshots_Examples

https://drive.google.com/drive/folders/11wpDo_sJ434pPAh8maXA6TbOSke6WHZE?usp=sharing

Check your email!

FASRC: Logging In & Launching RStudio 🚀

  1. Get on the VPN
  2. Go to the Open OnDemand site https://rcood.rc.fas.harvard.edu
  3. Log in with FASRC Account details
  4. Launch a RStudio Server session
  5. Create and save an R file (You can also download the example file 1_FASRC_step4_example.r)

Your work is now on a backed-up, high-performance server.

OH NO‼️ MY INTERNET WENT DOWN/FIREFOX CRASHED/MY LAPTOP WAS EATEN BY NEMATOADS ‼️

Workflow Benefit #1: Efficiency with High Performance Compute Clusters

FASRC is a high performance computing resource whose professional responsibility is to save you (and your data) from yourself 4 5

  • OpenOnDemand sessions persist as long as the job is specified
  • File permissions mechanisms are specific and deliberate
  • Software will (likely) never crash due to a mistake on your part
  • You will (likely) never break FASRC

Let’s go back to our work from yesterday… wait, what was I doing again…?

library(ggplot2)
library(dplyr)

model <- lm(mpg ~ wt + hp, data = mtcars)
new_data <- data.frame(wt = c(2.5, 3.0, 3.5), hp = c(100, 150, 200))
predictions <- predict(model, newdata = new_data)

plot <- ggplot(new_data, aes(x = wt, y = hp)) +
  geom_point() +
  geom_smooth(method = "lm", se = FALSE, color = "blue") +
  geom_text(aes(label = round(predictions, 2)), vjust = -1, color = "red") +
  labs(title = "Predicted MPG based on Weight and Horsepower",
       x = "Weight (1000 lbs)",
       y = "Horsepower")
print(plot)
---
title: "My fantastic analysis"
format: 
  html:
    self-contained: true
date: now
author: "Squidward P. Tentacles"
---

In this analysis I'm going to use the `mtcars` dataset to
demonstrate regression and prediction.

## Libraries

Here are the necessary libraries you'll need to replicate this...

```{r}
library(ggplot2)
```

## Fitting the model

I chose to use the `wt` an `hp` variables as predictors because blah blah blah...

```{r}
model <- lm(mpg ~ wt + hp, data = mtcars)
```

## Predict on New Data

I'm creating some new data to predict on...

```{r}
new_data <- data.frame(wt = c(2.5, 3.0, 3.5), hp = c(100, 150, 200))
predictions <- predict(model, newdata = new_data)
```

And plotting it with ggplot:
```{r}
plot <- ggplot(new_data, aes(x = wt, y = hp)) +
  geom_point() +
  geom_smooth(method = "lm", se = FALSE, color = "blue") +
  geom_text(aes(label = round(predictions, 2)), vjust = -1, color = "red") +
  labs(title = "Predicted MPG based on Weight and Horsepower",
       x = "Weight (1000 lbs)",
       y = "Horsepower")
plot
```

## Conclusion

In this notebook I ran an experiment and documented it so that next time
I or someone else sees it they can know exactly what I did
and why 😁

Literate Programming with Notebooks 🖼️

  1. Reopen RStudio session
  2. Convert your RScript to a notebook
  3. Add a YAML header to title, date, and sign your notebook
  4. Add a story to your script to explain what you’re doing (Or download and add 2_LiterateProgramming_step1_example2.qmd to your project)

Literate Programming with Notebooks🖼️

“💡Documentation is like a love letter you write to your future self” (Damien Conway) 6

  • (Knuth, 1984 7) Literate programming is the intertwining of written and machine language to self-document and explain code.

  • A program’s source code is made primarily to be read and understood by other people, and secondarily to be executed by the computer.

  • In data science, we use notebook tools like Quarto, RMarkdown, or JuPyter to combine narrative, code, and outputs

Workflow Benefit #2: Transparency with Notebooks 8

  • Notebooks provide narrative context, code, and outputs in one place
  • Enable others (and your future self) to understand and reproduce your work
  • Great for supervisor meetings, review, and sharing
  • Encourage “writing as thinking”

Notebooks aren’t just for code outputs…

Reports in pdf, word, and html

Dashboards for data analysis

More dashboards

Even more dashboards

Interactive maps

Blogs

Organizational websites

Books

More books

Manuscripts!

A manuscrupt I’ve contributed to/authored

🤯🤯🤯

THIS PRESENTATION IS A NOTEBOOK

Your lab mate is not convinced that lm() and glm() are equivalent in R, so you decide to demo it and share your notebook with them…

Modularity in Data Science 🗃️

  1. Open your analysis notebook
  2. Read data from an external URL
  3. Show that the two regression functions are equivalent
  4. Share the notebook so that they can try it for themselves (Download and and add 3_Modularity_step1_example3.qmd to your project and try to run it)

Your code

them running your code

Organize Projects with here(), configs, and renv

  • Use here::here() instead of "../" or "~/Downloads/"
library(here)
here("data", "input.csv")
  • Use configs to manage paths outside of the project
  • Keeps paths portable and self-documenting
  • Helps build & maintain structured projects

default:
  data_dir: "/nfs/shared/data"
  results_dir: "/nfs/shared/results"
  madagascar:
      shapefile: "https://data.humdata.org/dataset/26fa506b-0727-4d9d-a590-d2abee21ee22/resource/ed94d52e-349e-41be-80cb-62dc0435bd34/download/mdg_adm_bngrc_ocha_20181031_shp.zip"
  • Use renv and/or conda to manage packages
  • Allows you to document exact package versions and dependencies for each project
  • Stores package metadata in a text file that can be version controlled and shared with your project

Workflow Benefit #3: Modularity with path & package managers 9 10

  • 👯 Collaboration: Modular code is easier for teams to understand, reuse, and extend.
  • How can you make your code more modular?
    • 🧭 Portability of location: Use tools like here() to manage file and document paths
    • 🏗 Portability of dependencies Use tools like renv or conda to manage package dependencies
    • 🎁 Portability of code components: Use functions and modules so that code can be reused and tested independently
  • 📈 Scalability: Modular workflows adapt easily to new data, collaborators, or computing environments.

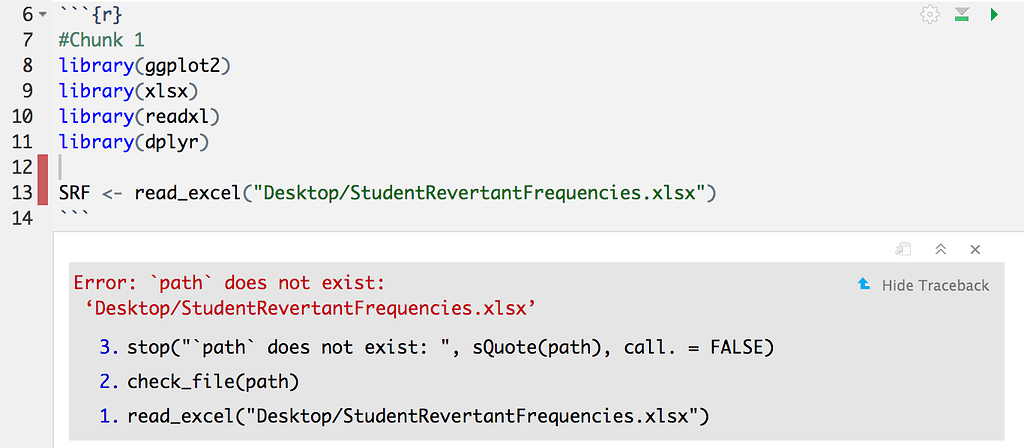
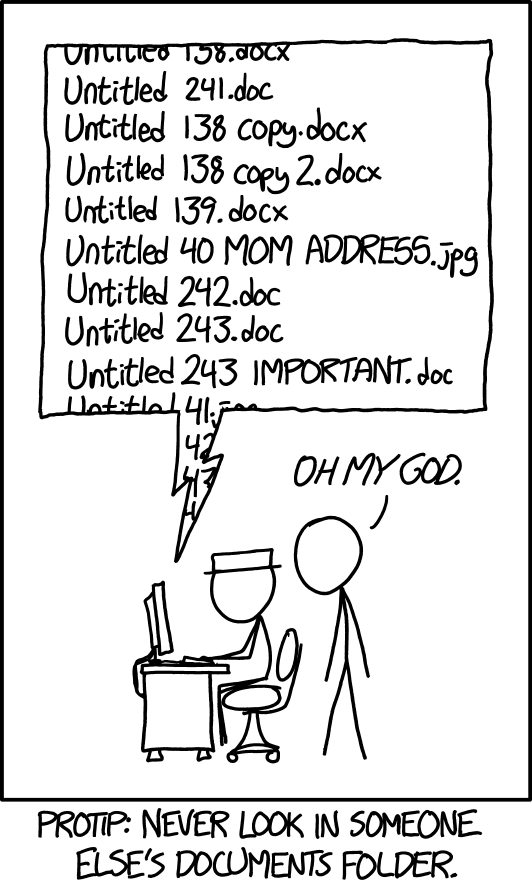
It’s time to publish your groundbreaking paper on the equivalence of glm and lm! You’ve run the analysis three times now: fantastic_analysis_v3.R, final_FINAL.Rmd, and FINAL_revised_with_comments_v2.qmd.

During a meeting, the PI asks:

“Can you show me what changed between the version we worked on 6 weeks ago and this one you sent me yesterday?”

Version Control with Git & GitHub

Why Git?

  • Track every change you make
  • Recover and understand past versions
  • Collaborate without fear

Version Control with Git & GitHub

  1. Set up your GitHub Account with secure PATs (Personal Access Token = Special Password 😉) with usethis::create_github_token()
  2. Initialize a git repository for your project with usethis::use_git()
  3. Track some changes
  4. “Push” the changes to GitHub for backup and sharing with usethis::use_github()
  5. Open GitHub to see your code reflected!

Workflow Benefit #4: Traceability with Version Control 11 12

  • No more file clutter: Replace final_v3_revised_REAL_FINAL.Rmd with clean version tracking

  • Precise change history: Git tracks edits line by line — you know what changed, when, and why.

  • Intentional work: Use git as a daily lab notebook where commits encourage reflection (what did I do today, and why?)

  • Safe collaboration: Work in parallel without overwriting each other’s code using branches and pull requests. Experimentation is encouraged

  • Work with the garage door up: Share your process early, even if it’s not polished. GitHub lets collaborators see your progress and offer feedback or help sooner

You’ve spent all of this time working on reproducibility, but your collaborators simply do not care for it…

“This is so much overkill for a small analysis”

“I’m not a computer scientist I really don’t care about any of this! I don’t want to learn a new package”

Doing all of this is so slow! I can just use Excel, my old workflow has worked fine so far

I get it; it’s a lot 😰

The reproducibility iceberg 13

  • It’s a learning process/investment with benefits accruing over time
  • Adopting these principles gradually is fine — start small, but start now.
  • These principles aren’t about using fancy tools — they’re about creating systems that are beneficial to your future self and your collaborators.
  • Labs that adopt reproducible workflows produce cleaner, more sustainable+trustworthy science.

Labs that don’t…14

Reproducible collaboration requires compromise 🤝

We want reproducibility.
They might want convenience.

You can’t force everyone to use Git, FASRC, Quarto, etc. all the time

You can compromise — and still keep your workflow clean — by finding and implementing creative middle-ground solutions.

For e.g., the pins package 📌

Accessing Google Drive with pins📌

  • Google Drive (and friends) don’t neatly fit into the workflow (for reasons we’ve discussed)

  • How do you share data with outside Harvard collaborators?🧐

  • How do you couple your data science to other academic workflows?

  • pins solves this by providing versioned programmatic access to Google, Box, OneDrive etc.

  • Treats data objects in R/Python/Javascript as “pins” and online locations as “pinup boards”

Accessing Google Drive with pins📌

  1. Create a board in R from the Google Drive
  1. install.packages("pins")
  2. install.packages("googledrive")
  3. drive_id <- googledrive::as_id("https://drive.google.com/drive/folders/1MYoaffvU9ogu7nFo3Whz7XYVG1fq4wHY?usp=share_link")
  4. board <- board_gdrive(drive_id, versioned=TRUE)
  1. Create and write a pin for your glm() results
  1. pin_write(board, salary_glm_model, name="glm results", "Showing that the glm results are identical to the lm results")

Workflow Benefit #5: Flexibility with pins and Google Drive

  • pins gives you:
    • 🚀 Benefits of programmatic data science in R or Python
    • 🤝 Collaboration of Google Drive
    • 🪢 Coupling between your data science and the rest of your academic responsibilities
  • Your laptop is your personal desk ⌨️
  • FASRC is your wet lab bench 🔬🧪
  • GitHub is your collection of open, organically-growing, precise, lab notebooks 📚
  • Google Drive is your PII-safe vault for data 🗄 or bulletin board for outputs 📌

Use the tool that works best for the file type & data restrictions

What Belongs Where?

Type of Data Go To
🔐 Raw data from collaborators Google Drive & FASRC
💻 Analysis code (.R, .Rmd, .qmd, .py, plain text files) FASRC & GitHub
🖼️ Notebooks, tables, plots, etc. for review (PII-safe) GitHub or Google Drive
⚠️ Any form of sensitive intermediate outputs or code Google Drive
🧼 Cleaned/shareable datasets FASRC always; Google Drive if PII; Dataverse if anonymized

Recap: Your Sustainable Stack

Principle Tool What We Learned
Efficiency FASRC Remote computing
Transparency Notebooks Narrated and reproducible scientific analysis
Modularity here() + renv Robust file paths & environment isolation
Traceability Git + GitHub Version control and team collaboration
Flexibility googledrive + pins Reproducible I/O with shared cloud data

Congratulations! You’ve earned all 5 stars

Thanks! Let’s discuss…

  • Let’s build workflows that work for robust science — and for you.
  • My goal is to enable you to do your best work!

Footnotes

  1. https://www.nature.com/articles/533452a

  2. https://www.mdpi.com/2072-4292/17/9/1482

  3. https://www.nature.com/articles/sdata201618

  4. https://www.rc.fas.harvard.edu/cluster/publications/

  5. https://docs.rc.fas.harvard.edu

  6. https://www.azquotes.com/quote/1463174

  7. https://www.cs.tufts.edu/~nr/cs257/archive/literate-programming/01-knuth-lp.pdf

  8. https://www.nature.com/articles/d41586-018-07196-1

  9. https://www.mdpi.com/2624-5175/6/1/1

  10. https://link.springer.com/article/10.3758/s13428-020-01436-x

  11. https://journals.lww.com/epidem/citation/2025/05000/advancing_reproducible_research_through_version.8.aspx

  12. https://link.springer.com/article/10.1186/1751-0473-8-7

  13. https://www.nature.com/articles/s41597-025-04451-9

  14. https://www.bbc.com/news/magazine-22223190